Generating Industry-Leading ERD Well Designs
HXR provides Real-Time Geomechanical and Pore Pressure modeling using JewelSuite™ RT. JewelSuite™ RT is part of the complete JewelSuite™ 1D and 3D subsurface modeling platform. A modular software platform, JewelSuite™ is made up of PressCheck™ and WellCheck™, and is commonly used with another stress modeling program, call SFIB™. What makes these integrated software packages so powerful on the rigsite is that geomechanical models can be imported into JewelSuite™ RT, and the real-time data stream can be used to adjust the geomechanical models. This allows HXR’s Geomechanics Specialists, on the rig or in our RTOC, to quickly identify potential formation pressure and stress issues, alert the drilling team, and provide viable, accurate solutions — in real-time! Using the updated geomechanics data, engineering solutions can then be modeled by our onsite ERD Specialists, the drilling team can discuss, and parameters can easily be adjusted before a trainwreck is encountered.
A pre-drill geomechanics model, like those commonly used to design casing and mud wt windows on a given well, is only as good as its available data. The fact that the model uses offset well data will inherently generate inaccuracies and limitations to the analysis, since differences in the subsurface conditions can exist between the various offset wells and the target well itself, such as faults, fractures, changes in water depth, uplift, or truncated bedding. Streaming RT LWD data from the active well into a pre-existing geomechanical model allows the user to compare the actual values with the expected trends and identify changes in the formations expected behavior, which in turn allows the user to calibrate, or “tweak”, the pre-drill model, re-calculate it, and enhance the accuracy of its predicted values. Much like a Survey Ellipse of Uncertainty, where the more survey points you have, the more accurate your estimation of your actual wellbore position – the introduction of RT data into the geomechanics model acts in a similar fashion. The more you constrain the model and improve its accuracy while drilling in one section, it improves the prediction of pressures and stresses for sections ahead of the bit, yet to be drilled. This increase in the precision of the model looking forward can mean the difference between a trouble-free section, and quite possibly a lost section or sidetrack.
The LWD geophysical data, as well as the necessary survey data, can be imported into the geomechanics model through either a RT WITSML global server, directly through a local network location on the rigsite, or, in “neartime”, through LAS import. The software allows the user the opportunity to select which data to review and upload.
The below example shows a typical WITSML server setup. The connection is established through the “Inbound View”. The Inbound View provides an overview of the WITSML files imported such as project coordinate system, data logs, polling intervals, and five additional data retaining tabs. The information within the tree only is referred to as the Object Overview. The Object Overview shows all the objects that are part of the current connection.
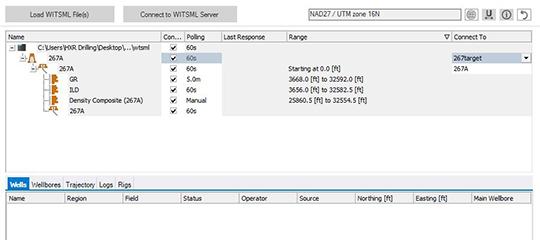
Inbound View with the connection name “C: \Users\HXR Drilling\Desktop\..” and logs selected to be imported by user. In this image polling is set at 60 seconds, 5 minutes, and manual. Each item can have a different polling interval at 5 minutes, 60 seconds, and manual. On the upper right the coordinate system is either uploaded from the prediction or can be changed. Along the bottom are the tabs that the well, wellbores, trajectories, logs, and rig information can be displayed.
As shown above, this application supports five different item types located on the tabs: wells, wellbores, trajectories, logs, and rigs. The wells-tab shows the selected wells and allows for editing of the northing and easting columns. The wellbores-tab shows the selected wellbores and provides information such as kickoff date, current and planned measured depths. The trajectory-tab displays information about the start and end time of the drilling run, azimuth, grid coordinates, and azimuth/depth units options. The logs-tab has an interactive table to select logs for import. For each log group imported the user can review depth range data per log. The rigs-tab is read- only and provides rig information such as rig name, derrick height, and owner.
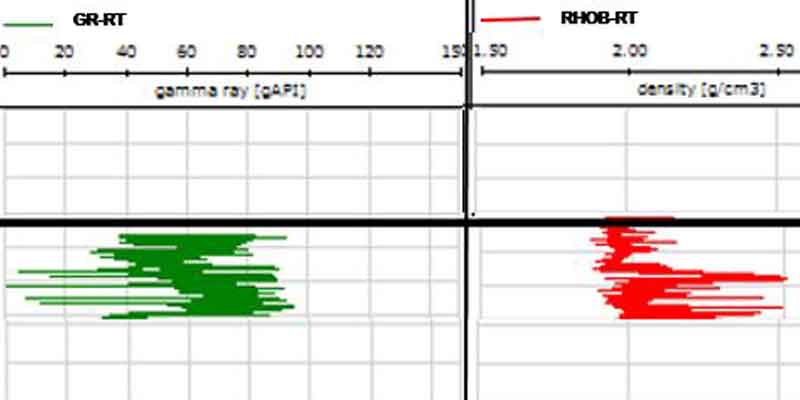
The most significant view in JewelSuite™ RT while drilling is the Real-Time Well Correlation View. The Real-Time Well Correlation View displays time-indexed logs on a time based track for real-time values as the data is collected. The real-time values can then be compared to the depth based prediction curves. The predicted formation pressure and stress can be updated as the real-time data is incoming.
Real Time WITSML Data in the Well Correlation View

JewelSuite™ RT can be used independently from PressCheck™ and Wellcheck™ but it is designed to be integrated so that the streaming data can be used to update the pre-drill models. HXR’s combined Geomechanics and ERD Engineering Specialists at the rigsite bring significant value to any drilling operation. Not only do HXR’s Geomechanics Specialists, having worked on building the pre-drill models as well as actively updating those models with RT data, allow for continuity in the analysis of the data, but they work hand-in-hand with our ERD Specialists in ensuring your wells have the greatest chance of success.
About the Author
Posted on: October 27th, 2015
Filed under: Blog, Extended Reach Drilling, Well Design, Wellbore Stability